MicroK8s 是 CNCF 认证的 Kubernetes 发行版,由 Ubuntu 背后的商业公司 Canonical 开发和维护。它和完整版的 Kubernetes 一样支持高可用特性(HA),支持快速组建 K8s 集群。适合用于边缘计算、IoT、以及使用 KubeFlow 的 MLOps 机器学习场景。
当然,也适合用于开发者本地环境,以轻量的资源消耗、简单的运维成本获得几乎完整的 Kubernetes 生态体验。本篇文章,我们来聊聊如何通过它来快速组建一个本地集群。
写在前面
早些时候,我写过一些关于 K8s 的搭建的实践内容,比如:《简单的 Kubernetes 集群搭建》使用的开源工具是 Kubernetes 官方开源工具 Kubeadm,相比 MicroK8s 整体搭建步骤会繁琐不少,更适合需要比较多定制的场景。关于 MicroK8s 的文章也曾写过一篇:《通过 MicroK8s 搭建你的 K8s 环境》,但接近三年过去了,软件的架构和使用方式上有了一些变化,教程自然也需要更新啦。
比如,早些时候分享这两个工具的时候,它们都还在使用 Docker 作为容器的运行时,时过境迁,社区中的工具纷纷支持了使用 containerd 替换掉 dockerd ,MicroK8s 自然也不例外,而且在部署安装 K8s 的体验上,更简单了不少。而且,每台用于计算的节点上的额外资源消耗也被控制在了 500M 左右,相比之前来说“瘦”了不少。
关于 MicroK8s、Charmed K8s、“标准” K8s 的差异,可以参考下面这张图:
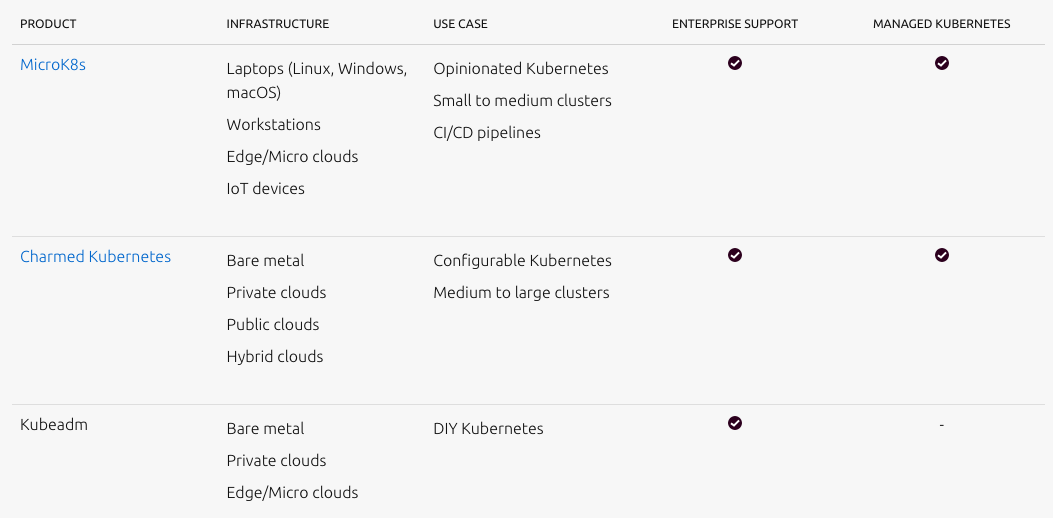
书归正传,我们来聊聊如何通过 MicroK8s 来搭建 K8s 集群。
准备工作
本篇文章中,我选择的部署环境是 Ubuntu,如果你对 Ubuntu 还比较陌生,可以参考这篇文章来完成 Ubuntu 的安装和基础配置,不过在参考的时候可以仅完成 Ubuntu 部分,忽略 Docker 部分的安装和配置,因为本文的容器运行环境选择 MicroK8s 内置的 containerd。
快速安装 MicroK8s
在 Ubuntu 环境下,安装 MicroK8s 非常简单,只需要一条 snap install 命令:
sudo snap install microk8s --classic
因为 snap 目前使用的 CDN 在国内表现还不错,所以下载和安装速度还是比较快的。稍等片刻,在命令成功运行之后,我们将能看到类似下面的日志输出:
microk8s (1.25/stable) v1.25.2 from Canonical✓ installed
如果你的安装环境是海外的云主机,那么此时你当前设备的 K8s 环境就安装就基本就绪了。但倘若你和我一样,是在国内的环境进行 K8s 环境安装,那么我们应该还需要进行一些调整,以及 K8s 运行状况自检,确保服务正确运行。
设置 K8s 命令别名(alias)
MicroK8s 支持的命令中,我们会相对高频的使用 microk8s.kubectl 这个命令,这个命令相比较官方默认命令 kubectl 长了不少,使用起来不是特别方便。我们可以通过 snap alias 来给命令起个别名:
sudo snap alias microk8s.kubectl kubectl
当命令执行完毕,我们将得到下面的日志输出,表示创建命令别名成功:
Added:
  - microk8s.kubectl as kubectl
接下来,我们就能够直接在系统中使用 kubectl 命令啦。
类似的,我们还可以将高频使用的 containerd 的主要命令 ctr 使用 snap alias 从 microk8s.ctr 中“映射”出来:
sudo snap alias microk8s.ctr ctr
以及 “helm / heml3” 这俩命令:
sudo snap alias microk8s.helm helm
sudo snap alias microk8s.helm3 helm3
解决 MicroK8s 安装后的常见问题
在完成 MicroK8s 的基础安装之后,常见的问题有几类:运行权限有问题、cgroup 配置有问题、缺少组件镜像。
解决 MicroK8s 运行权限问题
完成安装之后,想要在非 root 环境下使用,还需要做一些额外的工作。执行 microk8s.version ,我们可以得到下面的包含“引导信息”的日志:
Insufficient permissions to access MicroK8s.
You can either try again with sudo or add the user soulteary to the 'microk8s' group:

    sudo usermod -a -G microk8s soulteary
    sudo chown -f -R soulteary ~/.kube

After this, reload the user groups either via a reboot or by running 'newgrp microk8s'.
根据上面的日志输出,我们执行其中的命令,调整相关权限:
sudo usermod -a -G microk8s soulteary
sudo chown -f -R soulteary ~/.kube
执行命令后,重新登陆终端,再次执行 microk8s.version,可以看到一切就都正常了。
# microk8s.version
MicroK8s v1.25.2 revision 4055
解决 The memory cgroup is not enabled 问题
在安装之后,我们可以执行 microk8s.inspect 命令,来查看当前 MicroK8s 的服务状态是否就绪:
# microk8s.inspect

Inspecting system
Inspecting Certificates
Inspecting services
  Service snap.microk8s.daemon-cluster-agent is running
  Service snap.microk8s.daemon-containerd is running
  Service snap.microk8s.daemon-kubelite is running
  Service snap.microk8s.daemon-k8s-dqlite is running
  Service snap.microk8s.daemon-apiserver-kicker is running
  Copy service arguments to the final report tarball
Inspecting AppArmor configuration
Gathering system information
  Copy processes list to the final report tarball
  Copy disk usage information to the final report tarball
  Copy memory usage information to the final report tarball
  Copy server uptime to the final report tarball
  Copy openSSL information to the final report tarball
  Copy snap list to the final report tarball
  Copy VM name (or none) to the final report tarball
  Copy current linux distribution to the final report tarball
  Copy network configuration to the final report tarball
Inspecting kubernetes cluster
  Inspect kubernetes cluster
Inspecting dqlite
  Inspect dqlite

WARNING:  The memory cgroup is not enabled.
The cluster may not be functioning properly. Please ensure cgroups are enabled
See for example: https://microk8s.io/docs/install-alternatives#heading--arm
Building the report tarball
  Report tarball is at /var/snap/microk8s/4055/inspection-report-20221014_082840.tar.gz
在我使用的 Ubuntu 22.04 系统环境中,会遇到类似上面的错误,提示 cgroup 的配置有问题。
WARNING:  The memory cgroup is not enabled.
The cluster may not be functioning properly. Please ensure cgroups are enabled
See for example: https://microk8s.io/docs/install-alternatives#heading--arm
引起上面的错误的原因是默认的 /etc/default/grub 参数中,没有开启 cgroup memory。在官方社区里,有用户反馈了这个问题的解决方案:编辑 /etc/default/grub 文件中的 GRUB_CMDLINE_LINUX 参数,在其中添加“cgroup_enable=memory cgroup_memory=1” 等参数即可,我使用的参数:
GRUB_CMDLINE_LINUX="cgroup_enable=memory cgroup_memory=1 swapaccount=1 systemd.unified_cgroup_hierarchy=0"
完成参数更新之后,我们还需要更新系统引导参数,以及完成系统的重启:
sudo update-grub
sudo reboot
重启完毕,再次进入系统执行 microk8s.inspect,能够看到这个问题就解决啦。
解决 MicroK8s 无法正常运行的问题
在解决上面的问题之后,当我们执行 microk8s status ,可能会得到类似下面的日志输出,告诉我们程序并没有按照预期运行:
microk8s is not running. Use microk8s inspect for a deeper inspection.
我们可以执行 microk8s.inspect 查看是否有报错信息,如果没有任何报错,可以来通过 kubectl 来进一步排查问题到底出现在了哪里。
先通过 kubectl 获取所有 pods 的运行状况:
kubectl get pods --all-namespaces
命令执行完毕,将得到类似下面的日志结果:
# kubectl get pods --all-namespaces

NAMESPACE     NAME                                       READY   STATUS     RESTARTS   AGE
kube-system   calico-node-nnshm                          0/1     Init:0/2   0          9m
kube-system   calico-kube-controllers-67774c44db-mcmvx   0/1     Pending    0          9m
根据日志可以看到,有一个 pod 的状态是 “Init:0/2”,另外一个是“Pending”。这个排队启动的问题,是导致我们的 MicroK8s 没有正常运行的主要原因。
接着,使用 kubectl describe pod 来查看到底是为什么:
kubectl describe pod --all-namespaces
命令执行完毕,发现日志中容器运行原来是卡在了 k8s.gcr.io/pause:3.7 这个镜像的下载:
Warning FailedCreatePodSandBox 2m52s (x6 over 7m51s) kubelet Failed to create pod sandbox: rpc error: code = Unknown desc = failed to get sandbox image "k8s.gcr.io/pause:3.7": failed to pull image "k8s.gcr.io/pause:3.7": failed to pull and unpack image "k8s.gcr.io/pause:3.7": failed to resolve reference "k8s.gcr.io/pause:3.7": failed to do request: Head "https://k8s.gcr.io/v2/pause/manifests/3.7": dial tcp 142.xxx.xxx.xxx:443: i/o timeout
这里有两种方案可以解决这个问题,第一种是使用 ctr 命令下载所需要的镜像(可以搭配代理参数 https_proxy 使用):
# https_proxy=10.11.12.90:1234 ctr image pull k8s.gcr.io/pause:3.7

k8s.gcr.io/pause:3.7:                                                             resolved       |++++++++++++++++++++++++++++++++++++++|
index-sha256:bb6ed397957e9ca7c65ada0db5c5d1c707c9c8afc80a94acbe69f3ae76988f0c:    done           |++++++++++++++++++++++++++++++++++++++|
manifest-sha256:f81611a21cf91214c1ea751c5b525931a0e2ebabe62b3937b6158039ff6f922d: done           |++++++++++++++++++++++++++++++++++++++|
layer-sha256:7582c2cc65ef30105b84c1c6812f71c8012663c6352b01fe2f483238313ab0ed:    done           |++++++++++++++++++++++++++++++++++++++|
config-sha256:221177c6082a88ea4f6240ab2450d540955ac6f4d5454f0e15751b653ebda165:   done           |++++++++++++++++++++++++++++++++++++++|
elapsed: 2.6 s                                                                    total:  4.2 Ki (1.6 KiB/s)
unpacking linux/amd64 sha256:bb6ed397957e9ca7c65ada0db5c5d1c707c9c8afc80a94acbe69f3ae76988f0c...
done: 23.888296ms
或者,和《通过 MicroK8s 搭建你的 K8s 环境》一文中提到的“获取 Kubernetes 依赖镜像”一样的方式,采用导入 docker 镜像的方式,来解决问题:
# ctr images import pause-v3.7.tar

unpacking k8s.gcr.io/pause:3.7 (sha256:bb6ed397957e9ca7c65ada0db5c5d1c707c9c8afc80a94acbe69f3ae76988f0c)...done
当我们完成镜像的下载或导入之后,执行下面的命令重启 MicroK8s:
microk8s stop && microk8s start
再次执行 microk8s status,就能够看到程序已经处于正常运行状态啦。
# microk8s status

microk8s is running
high-availability: no
  datastore master nodes: 127.0.0.1:19001
  datastore standby nodes: none
addons:
  enabled:
    ha-cluster           # (core) Configure high availability on the current node
    helm                 # (core) Helm - the package manager for Kubernetes
    helm3                # (core) Helm 3 - the package manager for Kubernetes
  disabled:
    cert-manager         # (core) Cloud native certificate management
    community            # (core) The community addons repository
    dashboard            # (core) The Kubernetes dashboard
    dns                  # (core) CoreDNS
    gpu                  # (core) Automatic enablement of Nvidia CUDA
    host-access          # (core) Allow Pods connecting to Host services smoothly
    hostpath-storage     # (core) Storage class; allocates storage from host directory
    ingress              # (core) Ingress controller for external access
    kube-ovn             # (core) An advanced network fabric for Kubernetes
    mayastor             # (core) OpenEBS MayaStor
    metallb              # (core) Loadbalancer for your Kubernetes cluster
    metrics-server       # (core) K8s Metrics Server for API access to service metrics
    observability        # (core) A lightweight observability stack for logs, traces and metrics
    prometheus           # (core) Prometheus operator for monitoring and logging
    rbac                 # (core) Role-Based Access Control for authorisation
    registry             # (core) Private image registry exposed on localhost:32000
    storage              # (core) Alias to hostpath-storage add-on, deprecated
配置 K8s 集群
在完成 K8s 的安装之后,我们来进行集群部署。配置 K8s 集群的方式有许多种,本文中我们选择最简单的方案:多机多实例。
为了方便配置,我创建了三台虚拟机,并给他们起了一些有趣的名字。
10.10.10.200 potato
10.10.10.201 spud
10.10.10.202 murphy
我们选择第一个虚拟机 potato 作为初始节点,使用 microk8s add-node 声明“他是老大”,得到类似下面的日志:
From the node you wish to join to this cluster, run the following:
microk8s join 10.10.10.200:25000/68a9eb9b75c6b4f0caf02cfeae480d17/6b63774a9775

Use the '--worker' flag to join a node as a worker not running the control plane, eg:
microk8s join 10.10.10.200:25000/68a9eb9b75c6b4f0caf02cfeae480d17/6b63774a9775 --worker

If the node you are adding is not reachable through the default interface you can use one of the following:
microk8s join 10.10.10.200:25000/68a9eb9b75c6b4f0caf02cfeae480d17/6b63774a9775
此时,再次执行 microk8s status 会发现之前的输出日志有了变化,多了一行“datastore master nodes” 的日志输出:
microk8s is running
high-availability: no
  datastore master nodes: 127.0.0.1:19001
  datastore standby nodes: none
...
接着,我们可以选择性的将上面日志中输出的三种命令,分别在另外两台虚拟机 spud 和 murphy 中执行,比如:
microk8s join 10.10.10.200:25000/68a9eb9b75c6b4f0caf02cfeae480d17/6b63774a9775 --worker
当我们在另外两台虚拟机上执行命令之后,将得到类似下面的日志:
# microk8s join 10.10.10.200:25000/68a9eb9b75c6b4f0caf02cfeae480d17/6b63774a9775 --worker

Contacting cluster at 10.10.10.200

The node has joined the cluster and will appear in the nodes list in a few seconds.

This worker node gets automatically configured with the API server endpoints.
If the API servers are behind a loadbalancer please set the '--refresh-interval' to '0s' in:
    /var/snap/microk8s/current/args/apiserver-proxy
and replace the API server endpoints with the one provided by the loadbalancer in:
    /var/snap/microk8s/current/args/traefik/provider.yaml
需要注意的是,我们在第一台虚拟机 potato 生成的命令是一次性的,所以如果我们需要添加多个工作节点,需要重复在第一个节点中执行 microk8s add-node,获得带有不同的 token 参数的命令。
在上面的组网操作结束之后,我们回到第一台虚拟机 potato 中,执行下面的命令,检查所有节点的运行状况:
kubectl get pod -o=custom-columns=NAME:.metadata.name,STATUS:.status.phase,NODE:.spec.nodeName --all-namespaces
命令执行完毕,将会得到类似下面的结果:
NAME                                       STATUS    NODE
calico-kube-controllers-67774c44db-mcmvx   Running   potato
calico-node-sgj2r                          Running   potato
calico-node-9pvcz                          Running   spud
calico-node-45kcb                          Running   murphy
可以清楚的看到,三台虚拟机上各运行了一个名为 calico-node-* 的 pod,作为“老大”的 potato 节点上还额外运行了一个 pod 作为控制集群使用。
写到这里,K8s 的安装和集群的部署就结束了,是不是挺简单的?
启用 K8s Dashboard
MicroK8s 和完整版本的 K8s 一样,能够使用 Dashboard ,通过可视化的方式来检查各个组件的运行状况。
不过,如果你在上面中解决过“因为网络问题 MicroK8s 不能正常运行”的问题,那么我们需要分别在每一台虚拟机上执行下面的命令,来确保 Dashboard 组件镜像不会影响我们的服务运行。
ssh 10.10.10.200 "https_proxy=10.11.12.90:1234 ctr image pull k8s.gcr.io/metrics-server/metrics-server:v0.5.2"
ssh 10.10.10.201 "https_proxy=10.11.12.90:1234 ctr image pull k8s.gcr.io/metrics-server/metrics-server:v0.5.2"
ssh 10.10.10.202 "https_proxy=10.11.12.90:1234 ctr image pull k8s.gcr.io/metrics-server/metrics-server:v0.5.2"
倘若没有保障服务镜像存在,那么我们在执行 kubectl get pods --all-namespaces 后,将看到类似下面的错误:
kube-system metrics-server-6b6844c455-45kjc 0/1 ImagePullBackOff 0 1m18s
在确保镜像存在之后,我们执行 microk8s dashboard-proxy,将得到类似下面的日志:
# microk8s dashboard-proxy

Checking if Dashboard is running.
Infer repository core for addon dashboard
Waiting for Dashboard to come up.
Trying to get token from microk8s-dashboard-token
Waiting for secret token (attempt 0)
Dashboard will be available at https://127.0.0.1:10443
Use the following token to login:
eyJhbGciOiJSUzI1NiIsImtpZCI6IkQ5YVZyQ3VhdmhnNGx2Uzlya21FMTV3eGJoMlFGVnhfSGtyTGVBaFlzeEkifQ.eyJpc3MiOiJrdWJlcm5ldGVzL3NlcnZpY2VhY2NvdW50Iiwia3ViZXJuZXRlcy5pby9zZXJ2aWNlYWNjb3VudC9uYW1lc3BhY2UiOiJrdWJlLXN5c3RlbSIsImt1YmVybmV0ZXMuaW8vc2VydmljZWFjY291bnQvc2VjcmV0Lm5hbWUiOiJtaWNyb2s4cy1kYXNoYm9hcmQtdG9rZW4iLCJrdWJlcm5ldGVzLmlvL3NlcnZpY2VhY2NvdW50L3NlcnZpY2UtYWNjb3VudC5uYW1lIjoiZGVmYXVsdCIsImt1YmVybmV0ZXMuaW8vc2VydmljZWFjY291bnQvc2VydmljZS1hY2NvdW50LnVpZCI6IjM1ODA3YzEzLTY1Y2EtNDIzMi1hMzdjLTliZmMxMzlmN2I5OCIsInN1YiI6InN5c3RlbTpzZXJ2aWNlYWNjb3VudDprdWJlLXN5c3RlbTpkZWZhdWx0In0.d3r-7egJ8D2aCh5ZP1liN9m3luAU4MVbnjLxkcneQgeABYxaxdmc2uVqdDhsckmWCL9EBeVYfmLpxOwr0qjMuuKgTrpMsU7pcNG2CzeI-oY6_S6oBwBD9xZ-bBy5vtPA8TXKlUyYlGyJvtS_kyxaaxJPoumHmZcx2GVrQKnMfzXxabVrEAHYdPMEuIGX9ElGCiaIemT50gk2U9TXrvRrtDEkUM0ktNaeLcT6Bhr46Jf30X4Y7DP-vLJdAEI2gE3P-xVfIJHF9xLZDz0Kdw8nnguxuUIgbGZ4S1We637wlCWDErDcaoVhjJLJw61ZHGgBQ4NclebI8e1bXGZCqomXQA
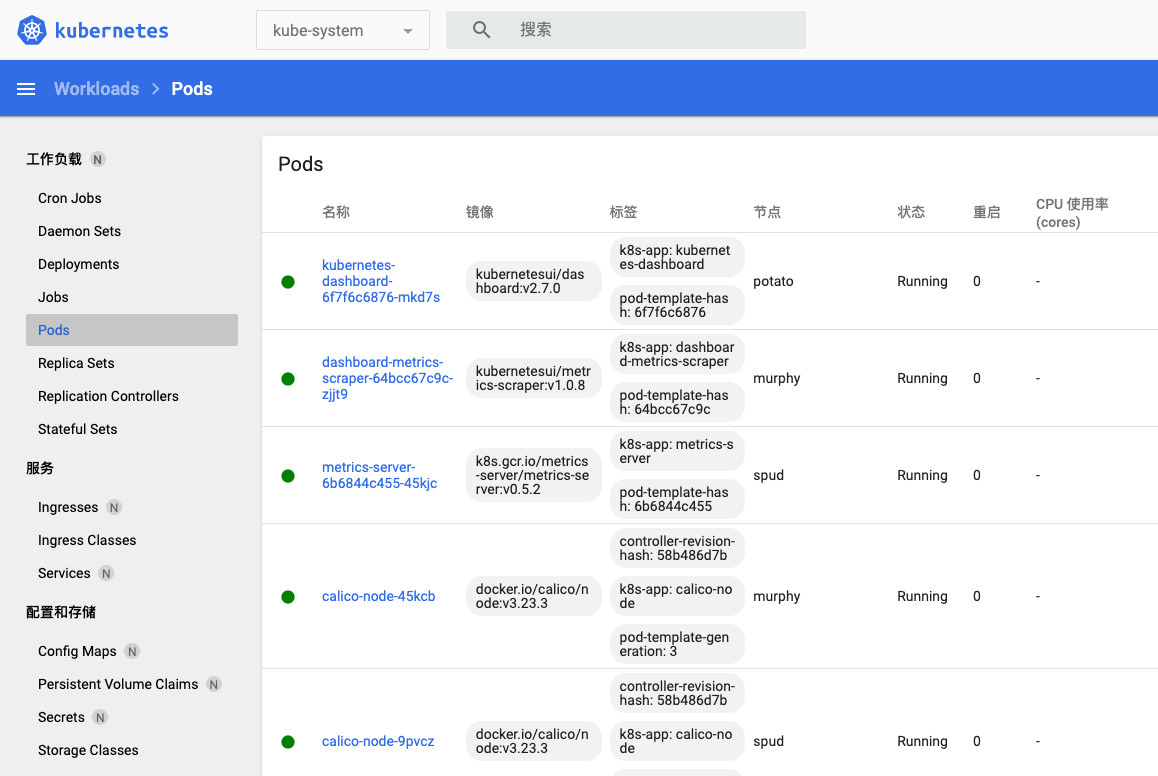
此时,如果我们执行 kubectl get pods --all-namespaces 来查看 pod 的运行状况,能够看到一切正常:
NAMESPACE     NAME                                         READY   STATUS    RESTARTS   AGE
kube-system   calico-kube-controllers-67774c44db-mcmvx     1/1     Running   0          1h
kube-system   calico-node-sgj2r                            1/1     Running   0          1h
kube-system   calico-node-45kcb                            1/1     Running   0          1h
kube-system   calico-node-9pvcz                            1/1     Running   0          1h
kube-system   kubernetes-dashboard-74b66d7f9c-46gk4        1/1     Running   0          1m
kube-system   dashboard-metrics-scraper-64bcc67c9c-zjjt9   1/1     Running   0          1m
kube-system   metrics-server-6b6844c455-45kjc              1/1     Running   0          1m
此时,K8s Dashboard 就运行起来了。
解决 K8s Dashboard 证书问题
不过,当我们尝试使用浏览器访问 https://127.0.0.1:10443 或者 https://10.10.10.200:10443(管理节点 IP 地址)的时候,会遇到因为证书问题,而打不开控制台页面的问题。社区里有记录,最靠谱的解决方案是我们自行生成证书,然后进行 Dashboard 的证书替换。
为了能够简单的解决这个问题,我做了一个只有 3MB 大小的 Docker 工具镜像,能够快速生成 K8s Dashboard 所需要的证书格式,使用方法很简单:
docker run --rm -it -v `pwd`/certs:/ssl soulteary/certs-maker --FOR_K8S=on
当我们执行完毕上面的命令后,在当前执行命令的目录中,将会出现一个 certs 目录,保存着我们需要的密钥文件。完整的工具代码和工具使用文档,可以访问 soulteary/certs-maker项目获得。
ls -al certs
total 24
drwxr-xr-x   5 soulteary  staff   160 10 15 19:30 .
drwxr-xr-x  12 soulteary  staff   384 10 15 19:30 ..
-rw-r--r--   1 soulteary  staff   805 10 15 19:30 lab.com.k8s.conf
-rw-r--r--   1 soulteary  staff  1692 10 15 19:30 lab.com.k8s.crt
-rw-------   1 soulteary  staff  1704 10 15 19:30 lab.com.k8s.key
你可以使用任何你喜欢的方式,将上面的证书文件复制到 K8s 的控制节点,然后执行命令,使用这个证书替换掉 K8s 默认的证书:
kubectl -n kube-system delete secret kubernetes-dashboard-certs
kubectl -n kube-system create secret generic kubernetes-dashboard-certs --from-file=lab.com.k8s.crt --from-file=lab.com.k8s.key
在完成证书替换之后,我们还需要编辑 K8s 配置,让 K8s 不再自动生成证书,而是使用我们提供的证书文件:
kubectl -n kube-system edit deploy kubernetes-dashboard -o yaml
使用上面的命令会自动打开 K8s 的配置,我们找到 --auto-generate-certificates ,将其注释掉,并添加我们刚刚导入的证书。
...
    spec:
      containers:
      - args:
        - --tls-cert-file=lab.com.k8s.crt
        - --tls-key-file=lab.com.k8s.key
        # - --auto-generate-certificates
...
编辑完成之后,关闭文件,K8s 服务将自动应用配置,再次执行 microk8s dashboard-proxy 后,就能够通过网页来访问 K8s 的控制面板了。
最后
除了 Dashboard 之外,MicroK8s 还包含了非常多的组件,常用的官方组件诸如:DNS、Cert Manager、GPU、Storage、权限控制、Registry。除此之外,还包含大量的社区组件。后面有机会的时候,我们具体展开聊聊它的最佳实践。
–EOF